


Sealing Fujifilm Prescale® pressure sensitive film for protection against fluid damage: the effect on its response
by A.B. Liggins, K. Surry and J.B. Finlay,
Orthopaedic Research Laboratory, University Hospital, University o/Western Ontario, London, Ontario, Canada, N6A 5A5.
Abstract
Fujifilm Prescale® pressure sensitivefilm will recordpressures as a characteristic pink stain; the optical density response of these stains can be calibrated to allow subsequent conversion into fullfield pressure data. Due to its ease of use, Fujifilm has been employed extensively within animal joints. For this application, the potential disruption to the stain producing mechanism posed by the presence ofjoint fluids has ledto the widespread use of fluid proof materials, within which the Fuj ifilm is protected; however, little data have been presented on the effect o/protective materials on the subsequent stain response. This paper presents a quantitative assessment of the mean optical density responses of both protected film and a control group of unprotected film; the first group consisted of Fujifilmsealed between two layers o/a readily available self’┐Įadhesive materialJonning sealed packets. The results indicated significant differences between groups (p < 0.05); however, the effect of these differences is dependent on the method used to produce pressure data. Qualitative observations indicated that sealing reduced stain uniformity; preliminary qualitative observations regarding daJa manipulation methods to overcome this phenomenon are presented. Consequently, this work indicates the importance of validating methods/or protecting Fujifilm from fluid damage and their associated methods 0/ data manipulation.
Keywords: Fuji film, protective sealing, pressure sensitive
Introduction
Fujifilm Prescale® pressure sensitive film (Fuji Photo Film Co., Ltd., Tokyo, Japan) will record interface pressures between 02 and 130 MPa; this range of pressures is achieved using five film grades, known as "ultra superlow", "superlow", "low", "medium" and "high". With the exception of the high grade film, this material is supplied as two sheets (the A and C films), each of which are coated with an active layer on one side; on high grade film, these layers are over laid on a single polymer substrate. The active layer of the A-film consists of liquid filled bubbles (approximately 2 to 25 μm in diameter) which burst on the application of pressure, thereby releasing their contents onto the active layer of the C-film. This mechanism produces a characteristic pink stain, the optical density of which is determined by the applied pressure. Below a lower threshold pressure, no stain is produced, while above an upper threshold pressure, the stain becomes saturated; between these pressures, the optical density follows a non-linear relationship with the applied pressure1.2. In addition to being pressure dependent, the response of Fuji film is sensitive to ambient conditions (temperature and humidity) and load rate1; consequently, the manufacturer supplies a series of charts, which provide eight colour samples, and calibration data for two separate load rates. Optical densities can be compared to the colour samples either visually or using the optional densitometer (item No. FPD301).
The previously described technique for producing such pressure maps employs twelve circular calibration stains, taken at different pressures across the film's range; these stains are produced using a 25.4 mm diameter punch and a 63.6 mm diameter base plate, both having finely ground surfacesl. Digital stain images are obtained using a CCD video camera and a PC computer running ImagePro Plus software (Media Cybernetics, Silver Spring, MD 20910, USA). Each pixel on these images corresponds to aO.1 mm wide byO.08 mm high sample area on the original stain; the optical density of each original sample area is translated into a corresponding "pixel value" between 0 (corresponding to "black") and 255 (corresponding to "white"). For each stain, a 190 pixel square box is defined within the stain boundaryl; the values of the individual pixels within this box are used to calculate a mean pixel value for the stain, thereby characterising the response for the pressure at which the stain was produced. The subsequent data are transferred to Sigma Plot software (Jandel Scientific, Core Madera, CA 94925, USA) and a best fit fifth order polynomial relating pressure to pixel value is calculated. Custom written software can then be used to render any test stain image as a false colour pressure map; this transformation is achieved by using the fifth orner calibration relationship to calculate the pressure corresponding to the pixel value of a sample area at any position on the test stain and then redrawing that area as a single colour corresponding to an appropriate pressure interval. The size of the sample area and pressure intervals used in the production of pressure maps are determined by the spatial and pressure resolutions of the Fuji film19.
In a physiological joint, the presence of joint fluids may interfere with the passage of bubble fluids from the A film to the C film, thereby disrupting the stain producing mechanism and frustrating the calibration procedure. While this problem has led Bourgois and Bepo to develop a new pressure sensitive film, a more direct approach is to place Fuji film between two layers of fluid resistant material. Practical fluid proofing techniques range from simply placing domestic food wrapping film over the articular surfaces6 to sealing the Fuji film in custom made fluid proof packets4,8,12,15,17,21. Fluid proof packets have been produced from either commercially available self-adhesive tapel.8,9, or from polyethylene film, which was either sprayed with a glue torender it self-adhesive2,15,17, or used as supplied, with the packet edges sealed using adhesive tape4. Using a self- adhesive packaging material will prevent relative motion of the A and C films and hence reduce any artefactual shear response; however, it can be envisaged that one problem with custom made self- adhesive material lies in producing an even layer of adhesive. Singerman et al2 indicate that sealing materials affect the shape and magnitude of the pressure vs stain density relationship, when comparing the response of sealed packets to unsealed continuous sheet; however, different loading surfaces ("parallel platens" and "elastic disks", respectively) were described for the sealed and unsealed groups. In addition, these observations were made using a previous form of Fujifilm which employed apaperlike substrate as compared to the stiffer, polymer based, substrate in current use.
In the absence of any suitable statistical analyses, it is unclear whether it is necessary to produce separate calibration stains using sealed or unsealed film, when sealed film is to be used for data collection; consequently, the objective of this work was to quantify the effects of protective sealing on the pressure r~sponse of Fuji film when loaded under the same conditions as unsealed film.
Materials and methods
One hundred 35 mm square pieces of both A and C film were cut from super low grade (0.5 - 2.5 MPa range) Fuji film. Fifty pairs of A and C fIlm formed the control group; the remaining fifty pairs were each sealed between two layers of "Tegaderm" adhesive surgical dressing (3M, Canada), forming fifty sealed packets. Tegaderm is a thin (60 J.UI1 thick), pliable, material which resembles food wrapping film with an adhesive layer on one side. This material is supplied in 60 mm x 70 mm sections with a wax paper backing on both sides; the centre of the backing on the non-adhesive side can be removed, leaving a stiff border (7 - 15 mm wide), such that the material is held flat prior to application. Fifty pieces ofTegaderm were cut in half and the adhesive revealed. The Fuji film pieces were cleaned using compressed air and then gently unrolled onto the adhesive, with the active surface uppermost (Fig. la); this method of application allowed the film to be fixed in place without applying direct pressure to its surface (which would prematurely burst bubbles on the A film) while also reducing the possibility of trapping pockets of air between the film and Tegaderm. Pieces of A and C film, on their respective Tegaderm backings, were then placed together and the edges sealed; the wax paper borners on each side of the packet were then removed, leaving a sealed Fuji film packet (Fig. 1 b). Visual inspection of these packets revealed any artefactual staining caused by the packeting procedure; such staining resulted in rejection of a packet from the study. The two film groups (control and sealed) were used in the following protocols.
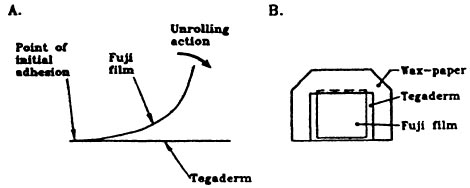
Fig. 1 The construction of sealed Fuji film packets
1) 25.4 mm diameter calibration stains were produced for each film group, using the punch and base plate assembly described above, for twelve pressures between 0.25 and 3 MPa1. An MTS 858 Bionix electrohydraulic universal testing machine (MTS Systems Corporation, Eden Prairie, MN 55344-2290, USA), in conjunction with an MTS 410.80 function generator, was used to apply the required loads; loading followed a regime of a one minute linear ramp up (’┐ĮO.1 % linearity) to a load corresponding to the desired pressure, a one minute hold at that pressure (’┐Į2 kPa), followed by a one minute linear ramp down to a ION preload. During this procedure, the temperature was 23’┐ĮC and the relative humidity (RH) 48%.
2) Three calibration stains were produced, from both film groups, at each of four mean pressures (0.5, 0.9, 1.8 and 2.5 MPa), utilising the same loading conditions as for protocol1. This procedure was conducted on three separate days, with mean (’┐ĮSD) relative humidities of 59.4 (0.5) %, 54.2 (0.3) % and 66.2 (0.7) %; the temperature was 23 ’┐Į 1 ’┐ĮC during these tests.
After a "development period" of fifty hours, the stains were digitised following the standard procedure discussed above and a mean pixel value (optical density) obtained for eachl. The data from protocol 1 were used to produce a fifth order polynomial calibration relationship between pressure and pixel value for each film group1. A combined analysis of variance (ANOV A) test was applied to the data from protocol 2, to test for any significant differences between the two film groups; the coefficient of variation (COV) for the mean pixel values for each group at each pressure and RH value (n=3) were calculated as an indication of repeatability.
Results
Fig. 2 shows the calibration curves obtained from both film groups (protocol 1). The curve for the control group is consistent with previous observations of film response1; however, while the sealed group data are all within 3 % of those for the control group, the corresponding calibration curve is (qualitatively) dissimilar. The 95 % confidence intervals for each fifth order curve overlap notably and, for clarity, are not shown.
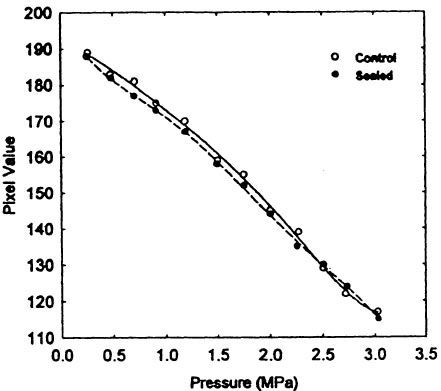
Fig. 2 Calibration curves for control and sealed group Fuji film
Fig. 3 shows a graphical representation of the data obtained
from protocol 2. The combined analysis of variance applied
to these data indicated significant differences (p Discussion The results from this experiment allow a direct comparison
of the responses of sealed and unsealed "super-low" grade
Fuji film, when using identical loading protocols.
Qualitatively, the calibration procedure (protocol 1)
produced a fifth order polynomial regression for the sealed
Fuji film which was close, but of dissimilar shape, to that
for the unsealed film. The marked shape differences between calibration curves for the two film
groups presented by Singerman et al2 were not observed; the
95 confidence intervals for the fifth order regressions
corresponding to each film group overlap, suggesting that
little difference exists between groups. The coefficients of variation (COV) calculated from the
mean pixel values obtained from sealed and unsealed film
at each of four nominal pressures and three relative
humidities (protocol 2), indicated a high degree of
repeatability (maximum COV = 3%) for both groups, A
combined analysis of variance (ANOV A) test conducted
on the results obtained from protocol 2 indicated significant
differences between the two film groups on two occasions
(1.8 MPa/59.4 RH and 2.5 MPa/59.4% RH). The cause of
these isolated cases of significance (at the intermediate
value of humidity) is unknown and requires further
investigation. It was postulated that the humidity at the time
of sealing was trapped within each packet, causing the
differences; however, if this were the case, the results from
the sealed group would be expected to be the same for each
value of ambient RH, since all fifty packets were produced
under the same conditions. Taken in isolation, these results
suggest that, when using sealed super-low grade Fuji film
in a test situation, the calibration protocol should also be
conducted on sealed film; however, these rmding should
be considered in conjunction with the methods used to
render the pixel value data as false colour pressure maps,
as follows. The digitised image of any stain produced at a single
uniform pressure will present a range of pixel values; this
range exhibits an inverse relationship with the sample area
size used to analyse data from the stain image.19
Consequently, it is necessary to divide the pressure range
for any grade of Fuji film into a number of pressure intervals; each interval is represented by a single colour
on the subsequent pressure maps". Ideally, these intervals
should be large enough such that the range of pixel values
from a stain taken at a single uniform pressure translate
(via the appropriate calibration curve) into pressure data
lying within a single pressure interval. Since this
approach would lead to an impractically small number of
intervals, the compromise of using the standard deviations
of pixel value data, calculated for calibration stains across
the pressure range of the film has been suggested". This
method results in the overflow of data into the adjoining
pressure intervals19; however, as the sample area size is
increased this data overflow represents a smaller proportion
of the pressure range, due to the decreased valid pressure
interval size19. Therefore, it can be seen that the errors
which would be incurred by using unsealed film to calibrate
sealed film will have an effect on the resulting pressure
map dependent on the spatial resolution (sample area size)
and number of pressure intervals chosen. For a small
sample area size (high spatial resolution), the increased
pressure interval size and data overflow will be dominant
over the effect of any calibration errors caused by the use
of unsealed film; consequently, it would appear reasonable
to use unsealed film to produce calibration data in this case.
Ifahighpressureresolution is required (with an associated
increase in sample area size), then the increased number of
(smaller) pressure intervals and the associated observed
reduction in data overflow will probably cause any errors
to have a noticeable effect on the resulting pressure map;
clearly, in this case it would be prudent to use sealed film
to produce calibration data. During this experiment, it was observed that stains from
the sealed group typically exhibited reduced stainuniformity,
compared to the control group; the cause of
these differences is unknown, but may be due to the
distribution of adhesive on the Tegaderm, although this
would be expected to be carefully controlled. Due to the
high degree of repeatability observed in protocol 1, it
would appear unlikely that this apparently random
phenomenon would account for the significant
differences observed between film groups at 59.4% RH.
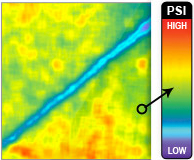
Fig. 4 shows stains taken (during the course of protocoll)
at 2.2 MPa using both unsealed (Fig. 4a) and sealed (Fig.
4b) film. It can be envisaged that the grossly uneven stain
produced by the sealed film will directly affect the film's
ability to resolve pressure information. The previously
reported methods for assessing the pressure
intervals required on a pressure map for a given sample
area19 assumed an even distribution of optical densities
across any calibration stain; therefore, they are inapplicable
for an analysis of the sealed group of stains. Consequently,
it is only currently possible to provide a qualitative
assessment of the effect of sealing on spatial resolution. Using the calibration relationships calculated in protocol
l, the stains in Fig. 4 can be rendered as false colour
pressure maps as shown in Fig. 5. These images were
created using single pixel sample areas (representing the
greatest spatial resolution possible on the current system)
and the corresponding four pressure intervals, defined
previously"; the additional "white" and "black" pressure
intervals represent areas which are below the lower
threshold or above the upper threshold of the film's
response, respectively. The unsealed film (Fig. Sa) presents
a typical rendered image for a calibration stain!'; a pressure
interval of 1.8-2.5 MPa is indicated across the majority of
this stain, with some over-flow into the adjoining pressure
intervals. The stain from the sealed film produces a rendered
image (Fig. 5b) in which the area~ of pressure interval
overflow form larger clusters. Consequently, this typical
result indicates that the uneven response from Fuji film
sealed in Tegaderm makes it unsuitable for assessing
interface pressures and that an alternative sealing material
be sought; however, it is possible to manipulate the
numerical data obtained from the original stain image in
an attempt to "smooth" the sub,:equent data presented on a
pressure-map, as follows. As mentioned above, increasing the sample area size used
to obtain optical density data from a stain image allows a
greater number of pressure intervals to be used on
subsequent pressure maps. Similarly, an increase in
pressure interval size for any given sample area size will
result in reduced pressure interval overflow; this effect
provides greater pressure map uniformity, at the cost
of reduced pressure resolution. Fig. 6 shows pressure
maps obtained from the sealed group stain of Fig. 4b, using
four pressure intervals and both 0.5 mm square (Fig. 6a)
and 2 mm square (Fig. 6b) sample area sizes; these sample
area sizes would normally be associated with six and eight
pressure ranges respectively19. From these typical
examples, it can be seen that increasing the sample area
size does not fully address the uneven pressure response
from the sealed film; therefore, this approach would appear
to be inappropriate. An alternative method for smoothing optical density data
is to combine data numerically from a number of stains to
produce an "average-stain-image". Pixel values
corresponding to the same position on each of a number of stain images are added and amean value calculated, giving
a new "average pixel value" for that position; in this way,
the effect of any dominant artefactual features on anyone
stain will decrease with an increa.ing number of combined
stain images. Fig. 7 illustrates the effect of combining four
(non-overlapping) 8.5 mm square sections taken from
the sealed film stain of Fig. 4b; this pressure map was
produced using 0.1 mm square sample areas/four pressure
intervals and the resulting images spatially magnified by a
factor of two compared to Figs. 5 and 6. Fig. 7a represents
a map of a single segment; Figs. 7b-7d represent the effect
of progressively combining an additional segment. It can
be seen that as the number of combined stain segments is
increased, the effect caused by the uneven pressure response
of the sealed film is noticeably reduced, suggesting that
this method would be an effective cure for this problem.
A quantitative analysis of this method is beyond the scope
of this paper; however, such an analysis will form the basis
of a future report. Any method for smoothing data from sealed film will have
a direct effect on the number of pressure-intervals which
can be used for any given sample area size and the degree
of data overl1ow; therefore, the method chosen will be a
further factor in the choice of sealed or unsealed film for
the production of calibration data. Conclusions Sealing Fujifilm Prescale® pressure sensitive film between two
layers of Tegaderm adhesive surgical dressing, to render it
fluid proof, has been shown to have a significant effect on
the film's response under one of three experimental ambient
conditions; however, the effect of using unsealed film
to produce calibration data for sealed film will be dependent
on the subsequent methods used to render the stain data as
a false colour pressure map. Consequently, the use of
sealed film for producing calibration data may only be
required when higher pressure resolutions are required; at
lower resolutions, the effect of any errors caused by using
unsealed film may be less than those incurred by the
rendering procedure. In addition, sealing produced a noticeable (apparently
random) disruption in stain distribution. Rendering these
stains as false colour pressure maps using previously
determined spatial and pressure resolutionsl9 results in
images containing a high degree of artifact; preliminary
qualitative observations suggest that this phenomenon
could be countered by averaging data obtained from
a number of stains, each of which would be taken from the
same interface, under the same loading conditions. A number of factors will detennine the choice of film
(sealed or unsealed) for the production of calibration data
to be used with sealed film. Clearly, a full quantification of
the effect of sealing on the response of Fuji film has been
demonstrated to be beyond the scope of this simple
experiment; however, this work provides an insight into
the potential problems which may be encountered
when using sealed Fuji film and indicates the need for
further quantitative analyses. References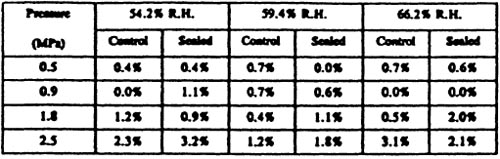
Table 1 - Coefficients of variation (COV) for groups of 3 stains (from both sealed and unsealed groups) taken at four pressures, at each of three relative humidities (RH)
![]()
Fig. 3 Mean pixel value vs pressure (n=3), for stains taken at 23oC and three separate relative humidities (all SD's are less than the symbol-size)
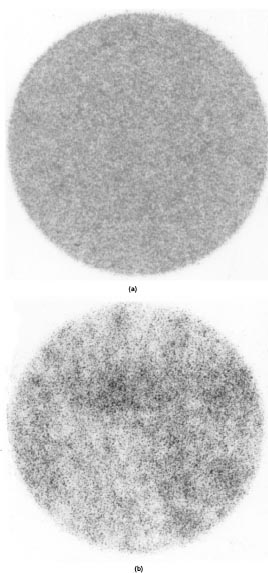
Fig 4 - Typical stains taken from a) the control group and b) the sealed group
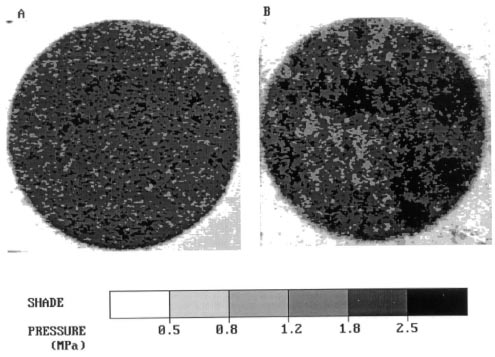
Fig. 5 - Pressure maps using a 0.1 mm square sample area and four pressure intervals
for stains taken at 2.2 MPa using (a) unsealed fUm and (b) sealed film
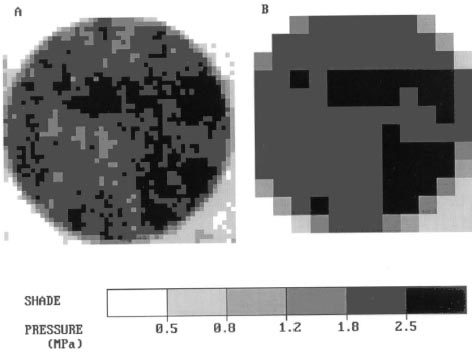
Fig. 6 Pressure maps for a stain taken at 2.2 MPa with unsealed film, using four
pressure intervals and sample area sizes of (a) O.5 mm square and (b) 2 mm square
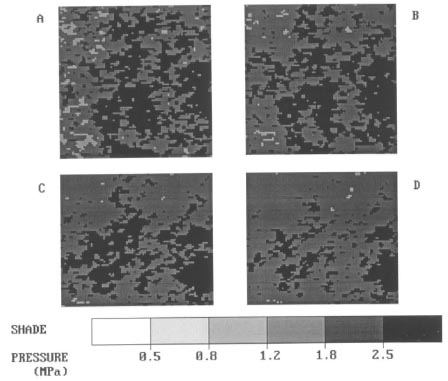
Fig. 7 The numerical combination of stain data (a) one stain (b) two combined stains
(c) three combined stains (d) four combined slains